Summit County Real Estate Ends Year With A Bang

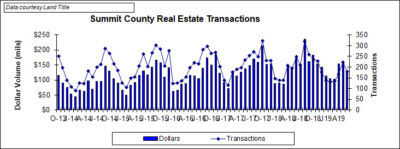
Summit County real estate sales ended 2019 with a big bang.  Dollar sales rose 27 percent to  $181.6 million while transaction volume increased  29 percent to 230 sales.  While transaction volume was essentially flat with November of this year, dollar volume was up 7.7 percent.

For the full year, dollar volume rose 9 percent to $1.9 billion dollars, the highest level in Summit County history.  Despite the strong December, transaction volume still failed to match the levels of 2018, falling 3 percent to 2,442 sales.

Price point trends for December and the full year followed a similar pattern.  Sales at the low end as a percentage of all sales trailed their historical norms significantly.  In the month, sales below $500,000 accounted for 29.2 percent of all sales and for all of 2019 that number was  32.2 percent.  In 2018, that range accounted for 37.2 percent and as recently as 2015 it was 59.9 percent.

Most of the mid tier price points at $100,000 increments from $500,000 to $2 million were ahead of 2018 while the $2.0-3.0 share dipped slightly.

For the full year, average selling prices (ASPs) rose for both single family and multi-family properties.  The single family ASP rose 10.5 percent to $1,262,929 al-though the year over year gain moderated as the year progressed.  Multi-family ASP increased by a more modest 6.9% reaching $559,776.  That was the smallest increase for the category since 2016 when multi-family prices rose only 2.6 percent.

The less impressive performance in the multi-family category could be explained by the inventories.  Total inventory in January 2020 fell from December in its normal seasonal pattern.  But, as has been the case for several months , January 2020 multi-family listings are up an impressive 42 percent year over year. Single family listings for the same time period were down almost 9 percent.

Posted in Random Thoughts | Comments Off on Summit County Real Estate Ends Year With A Bang

November Up in Both Transactions and Dollars

In November Summit County real estate sales saw a gain in transaction volume versus a year ago for the second month in a row.  The pattern for most of the year has shown positive comparisons on a dollar basis but a decline in the number of transactions. For November, dollar sales increased 10 percent over the 2018 level to $168.6 million.  That figure, however, was down 15 percent from the prior month. Transaction volume, with 231 sales, increased 2 percent versus a year ago but was down 19 percent from October.

For the year to date, dollar volume is up 7 percent to $1.7 billion.  Transaction volume, however is down 5%  to 2,212 sales with seven of the 11 months so far showing negative comparisons.

The year to date average selling price (ASP) for single family homes in the county stood at $1,264,516, the lowest level since January of this year.  Nevertheless the figure is up 11 percent from the full year 2018  number.  The ASP for multi-family properties stood near the high end of this year’s range at $563,656.  That represents a 9.9 percent increase over all of last year

As has been the case for much of this year, the low end of the market failed to keep its fair share of sales.  Properties below $400,000 were only  18.2 percent of sales in November.   That figure was 24.8 percent last year and exceeded 40 percent as recently as  2016.  Outperforming segments included the $400,000-$700,000, $1.0 to 1.5 million and $2.5 million + ranges.

Following the normal seasonal pattern, inventories at the end of December fell 11.6% from the November level.  Listings, however, are up 22.7 percent versus this time a year ago.  Once again, multifamily properties make up more than 100 percent of the gain rising 50 percent to 312 listings.  Conversely, single family homes for sale dropped  10.6 percent

Posted in Random Thoughts | Comments Off on November Up in Both Transactions and Dollars

Familiar Pattern Returns

Real estate sales in Summit County this year have followed a steady pattern of lower transaction volume but higher dollar sales.  In July that pattern was broken with increases in both categories but August returned to the familiar design.  While August transactions were up 19.7 percent from July, they were down 18 percent from the prior year period with 261 sales.

Dollar volume was up 41 percent from the July 2019 figure.  However, it squeaked up only 1 percent from the year ago period to $259.1 million.

Not surprisingly year to date numbers show the same dichotomy.  Transactions are down 10 percent while dollar volume is up 5 percent.

Relatively heavy activity at the high end of the market helped generate the overall rise in dollar sales. In August, there were nine sales of more than $3.0 million dollars.  There had only been 16 such sales in the prior seven months.

Year to date average selling prices (ASPs) ticked up in August from the prior month in both the single family and multi-family categories.  For single family, the year to date ASP is $1,307,236 in Summit County.  That represents a 15.7 percent increase over a year ago.  The ASP for multi-family properties hit $564,085.  That represents a gain of 12.4 percent from a year ago.  Raw land sales have averaged $328,602, down 13 percent.

Following its normal pattern, inventories peaked in August and have started their seasonal decline.  Nevertheless, inventories are up substantially from a year ago.  Overall, listings are up 52% from a year ago with 720 properties on the market.  Notably, more than 100% of that gain is in the multi-family category.  Listings of multi-family homes are up 112 percent from a year ago and fell by only 3 units in September to 480.  Meanwhile, single family inventory is actually down 3 percent to 239 homes.

Posted in Random Thoughts | Comments Off on Familiar Pattern Returns

July Sales Rebound

After a very weak June, Summit County real estate sales rebounded in July.  Transaction volume in the month rose 3 percent ahead of the year ago level.  It was up 21.8 percent from the prior month with 218 sales.

As has been the case most of  the year, dollar volume was even stronger.  Total dollar sales rose 12 percent to $168.9 million.  That figure was  34.9 percent ahead of the June 2019 period.

Despite the July gain, year to date  transaction volume is still down 8 percent from the 2018 levels.  Dollar volume, however, is up 6 percent year over year.

The year to date average selling price (ASP) for single family homes in the county dipped $40,00 from June coming in at $1,279,010.  That still represents a gain of better than 15 percent versus a year ago.  Conversely, the ASP for multi-family properties rose $9,000 to $558,995.  However, that number is only 8 percent above the year ago level.

The mix of sales for July followed the pattern we have seen most of the year with the low end of the market substantially under performing.  Sales below $500,000  represented only 28 percent  of  total transactions.  Year to date that number is 33.5 percent.  In 2018 that number was  37.2 percent and as recently as 2015 it was 60 percent.  The low sales are not a surprise given that only 25 percent of current listings are priced below $500,000.

After several months of sharp rises, the number of listings flattened in July with a total of 764 listings versus 759 the prior month.. Year over year, single family listings are up 5 percent and represent a little more than  one third of residential properties for sale.  Multi-family listings, however, are up a staggering 76 percent versus a year ago.  That places total listings up 41 percent.  If you are thinking of buying a condo or townhome,  this may be the best variety of choice you will have for quite some time.

Posted in Random Thoughts | Comments Off on July Sales Rebound

June Sales Take a Dive

June was a tough month for Summit County Real Estate sales as both transactions and dollar volume experienced sharp declines from the June 2018 levels.  The number of residential sales declined 28.1 percent from a year ago and were off 19.5 percent from May with 179 total sales.  Dollar volume took a similar hit falling 27.3 percent from a year ago and  21.2 percent from the prior month.  Sales for the month totaled $125.2 million.

For the year to date, dollar volume is still in the black.  Through June, dollar sales have totaled $757.7 million up 5 percent from the first six months of 2018.  Transaction volume for the period, however, is in negative territory declining 10% to 972 sales.

Despite the sharp drop in activity, average selling prices (ASPs) continued to rise. The ASP for a single family home in the county reached $1,319,418 up $9,000 from May and more than 23 percent from a year ago.  For multi-family units the increase in ASP was more modest.  At $549,387, the figure was up just under $1,000 from May and represented an 8.2 percent gain over the level at this time last year.

For the month, there was no discernible bias in the sales mix.  However for the year to date, we still see the lower end of the market running well below historical norms.  For example, so far this year, sales under $500,000 have accounted for 34.8 percent of total sales in the county.  In 2018 that figure was 37.2 percent and in 2015 it was 70 percent.

Inventories rose sharply in June, increasing 14 percent overall from May.  Year over year, total listings are up 44.5 percent.   Single family listings, which as of June had been flat, are now up 12 percent year over year.  The rise in multi-family listings, however, is even more striking.  The inventory of condos, town homes and duplexes is up an astounding 76 percent from the levels of a year ago.  This category has certainly become a buyers market.

Posted in Random Thoughts | Comments Off on June Sales Take a Dive

Sounding Like A Broken Record

The pattern of Summit County real estate sales is starting to sound like a broken record.  Once again in April, transaction volume fell. Dollar sales still managed to eke out a year over year gain.  In April 2019, total residential transactions, while up 23 percent from March, fell 19.8% from a year ago to 166 sales.  In contrast, dollar sales were up better than 50% from March and showed a positive comparison of 3.4 percent versus the April 2018 figure.   April was the seventh month in a row to post declining volume while dollar sales were down in only two of the months.

Year to date, transaction volume is down 10 percent with 571 sales.  Over the same time, sales in dollars are up 15 percent totaling $573.5 million.

Sales Mix Focuses on Higher End

Given the dichotomy between the transaction and dollar volumes it is not a surprise the mix of sales has shifted to the higher end of the market.  Year to date, all price points below $500,000 are below their historical norms as a percentage of the over all mix.  As a whole this segment represent 37.2 percent of total sales in 2018 and going back to 2015 the figure was 70 percent. This year, the number is 33.3 percent.

Average Selling Prices Rise

Average selling prices are also on the rise.  As of April the average selling price for a single family home in Summit County was $1,303,361.  That represents an 18.8 percent increase over a year ago.  Multi-family prices are also on the rise though more modestly. Year to date, the average price for a multi-family property was $564,025. That is an increase of 7.6 percent from a year ago.

Inventories Up Sharply

Listings bloom like flowers in the Spring and are up quite sharply.  Overall, inventories as of June 1 were up 21.5 percent from May 1. They are up 29.7 percent from a year ago with 559 total listings.  The bulk of those gains were in multi-family properties which are up 46.7 percent from this time in 2018 and account for 62.4 percent of all residential listings.  Single family inventories are up a much more modest 5.1% .

Posted in Random Thoughts | Tagged , , , , , , , | Comments Off on Sounding Like A Broken Record

February shows split market

The Summit County real estate market continues to exhibit Jeckell and Hyde tendencies.  Once again while we saw year over year gains in dollar volume, the number of sales once again declined.  For February,  sales totaled $104.7 million, a 17 percent  increase versus February of 2018. January had seen a 30 percent increase in dollar volume. There were 132 sales in the most recent period which like January was off 5% from the prior year. 

Notably, both dollars and number of transaction fell January to February of 2019.  Dollar sales were down  8 percent and transactions off 4.4 percent. Year to date compared to last year, dollars are up 23 percent and transaction down 5 percent.

Year to date average selling prices (ASPs) for single family properties posted a strong rise versus all comparisons.  The figure of $1,339,170 was up 7.9 percent from January this year, up 17.6 percent versus the year ago figure and up 17.2 percent over the average for all of 2018.  Multi– family pricing did not fare as well falling 3.3 percent from a year ago.

The sales mix in February favored the lower end and very high end of the market.  Properties in the $200,000—$700,000 range trended higher than 2018 in their share of overall sales.  Properties in the $700,000- $2 million fell short of their normal share while properties over two million ran ahead of last year.  However, given the low level of sales, 8 in February, their relative share can change substantially with 1 or 2 more or less sales in any given month.

Inventory has started its seasonal climb, especially in multi-family properties. Active multi-family listings rose 17.3 percent the end of March versus February.  Single family listings rose a more modest, 4.1 percent.  On a year-over-year basis, single family listingsare up 15.3 percent and multi-family properties have risen 11.8 percent.

Posted in Random Thoughts | Tagged , , , , , , , , , , , , | Comments Off on February shows split market

November Sales Flat

Although showing a normal seasonal decline from October, Summit County real estate sales in November were essentially flat with the levels of a year ago.  Dollar volume fell 15.8 percent from October to  $153.8 million.  However, that level was up 1.3 percent from the $151.9 million of a year ago. 

The seasonal drop in volume was a more modest 3.8 percent with  227 sales in November versus 236 in October.  Year over year, the volume of sales actually rose 1.3 percent.

Year to date, both volume and dollar comparisons are in the red.  Transactions are down 11 percent at 2,329 versus 2,377 while dollars are off  2 percent at $1.605 billion.

Sales mix shifted somewhat in the month with more mid to lower end sales.  Properties below $300,000 continued to underperform their historical norms as a percentage of sales but all $100,000 price points from $300,000 to $700,000 outdid their performance earlier in the year.  As a whole, properties under $700,000 represented  63.2 percent of sales  in November versus  58.6 percent year to date.

The average year to date selling price for single family homes ticked up to its highest level since January.  At $1,140,808 the figure stands 5 percent above the level a year ago and the full year 2017 figure.

Multi-family pricing has been somewhat strong.  While down slightly from October at $518,075, it sits  11.5 percent ahead of the October 2017 figure and  9.3 percent above the 2017 year end number.

Inventories at the end of December continued their seasonal decline.   Total active residential listings dropped from  396 to 378 with all that decline coming in the single family category.  Year over year, however, listings are up 25 percent for both single family and multi-family properties.

Posted in Random Thoughts | Tagged , , , , , , , , , | Comments Off on November Sales Flat

October Falls Short

Dollar volume for Summit County real estate activity picked up in October versus September but transactions were down.  Both categories fell short of October last year.  Dollar sales for the month totaled $182.7 million vs $161.9 million in September but were down 13.5 percent from a year ago. 

In October this year there were 236 transactions, down from 259 in September and off 27% from the 2017 period.

The year-to-date dollar sales are still in positive territory rising 7 percent to $1.45 billion.  The weak October transaction numbers, however, pushed the year-to-date transaction comparison into the red with a 2 percent decline to 2,102 sales.

Average selling prices for single family homes have held fairly steady through the year falling in the $1.1-1.2 million range.  At the end of October, the figure stood at $1,137,501, up 4.6 percent from the figure for all of 2017.  Multi-family properties have fared a little better rising 9.5 percent from the 2017 level.  However most of those gains were realized in the first two months of the year.  Since then, ASPs for multi-family properties have been flat to down.

As has been the case for most the year, dollar volume has outperformed transactions due more to a change in mix rather than substantial price gains for individual properties.  Year-to-date, properties under $400,000 have accounted for only 25% of sales (they were 21% in October) and that compares to 33 percent in 2017 and 42 percent in 2016.

While inventory is experiencing its normal seasonal decline, the fall off is nowhere near as sharp as last year.  As a result, total inventory is up  20.7 percent from a year ago led by 25 percent increase in multi-family units and 15% rise in single family homes.  Properties under $400,000 represent less than 10% of the inventory compared to the previously mentioned 25% of sales.

Posted in Random Thoughts | Tagged , , , , , , , , , , , | Comments Off on October Falls Short

September Sales Stay Positive

After what appeared to be a major surge of activity in August, real estate sales in September declined dramatically month to month but maintained single digital gains over a year ago. Transaction volume in September was off 19 percent from August with 259 sales. That number, however, was up 1.4 percent from the year earlier month.
Dollar volume was also off sharply from August falling, 31 percent to $161.9 million . Nevertheless, that figure was up 4.4 percent from a year ago.
Year to date there have been 1,866 transactions up 2% from a year ago. Dollar volume is up 11 percent at $1.27 billion.
As a percentage of overall sales, the low end of the market continues to underperform. This is primarily due to a lack of inventory. In 2015, 70 percent of the County’s sales were under $500,000 . That number has dropped each year since and year to date 2018 the figure stands at 47 percent. Currently, only 16 percent of listings are priced below $500,000. Obviously, properties at the lower end of the market are quick to sell.
Average selling prices for single family homes has been relatively stable through the year. Sales year to date have averaged $1,115,201, up 4 percent from this time a year ago and up 2.5% from the full year 2017 figure. Multi-family pricing has been somewhat strong. The year to date ASP for multi-family properties stands at $518,705, up 11.7 percent from this time a year ago and 9.6 percent from December of 2017.
Overall, inventories dropped 3 percent in October following the normal seasonal trend. What wasn’t normal was the fact that all that decline and then some came from a drop in single family listings, down 12 percent, while multi-family properties for sale actual rose by 6 percent.

Posted in Summit County Market Statistics | Tagged , , , , , , , | Comments Off on September Sales Stay Positive