Summit market maintains double digit gains

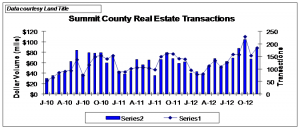
The real estate market in Summit County remained robust in July with a 23% increase in transactions versus a year ago. With 155 transactions, it represented the most active July since 2007 which saw 301 sales. Dollar volume was also up a solid 9% to $69 million against a strong year ago number as July of 2012 had seen a gain of 77%.
For the first seven months of the year, transactions are up 23% and dollar volume has risen 17% to $416.3 million.
Price point analysis shows that the distribution of sales for the month was consistent with the first half of the year. The largest number of transactions (21.5%) occurred in the $200,000 to $300,000 range and 66.1% of all sales were under $500,000. July did benefit from some high end sales with 9 transactions over the million dollar price point including one at $3.8 million.
Year to date, average selling prices (ASPs) of single family properties are tracking in line with last year at $774,356 versus $764,455 for all of 2012. Average selling prices for multi-family properties have dipped about 4% to $339,882 while lot ASPS have ticked up modestly from $309,512 for all of last year to $311,640.
After peaking in 2010-2011, foreclosure activity continues to be on the decline. So far this year, there have been 91 Notice of Election & Demand (NED), the start of the foreclosure process, and 72 Trustee Deeds issued—the end of the process. In 2012, there were a total of 251 NEDs and 165 properties that were sold at auction. At the peak, we had 367 NEDs and 227 sales. While never a major part of our market, the elimination of this distressed inventory should help overall pricing.

Posted in Summit County Market Statistics | Tagged , , , , | Comments Off on Summit market maintains double digit gains

First six months sees 23% increase in Summit County real estate activity

Although we saw a seasonal dip in June, year over year comparisons continue to show very strong gains. June closings rose 28 percent versus a year ago to 140 versus 109. Dollar volume increased 17 percent to $61.2 million. Both these numbers were down from May which saw 158 closings and $81.0 million in dollar volume. That decline is typical, however, as June sales generally reflect contracts signed during the April/May “shoulder” season when area visitation is at a low.
For the six months ended June, transactions increased 23 percent to 750 while dollar volume was up 18 percent to $347.3 million. In the first half of 2012, transaction volume was up a far more modest 3 percent. Transactions have now been on an upward trend for nine straight months, eight of which posted double digit gains.
While there were no residential sales for more than $2 million in June ( versus eight in the first five months) sales in the $1-1.5 million range were strong with 10 transactions, doubling the monthly average of the prior 5 months. Overall, the $200,000 to $400,000 range showed the strongest action with 45 transaction or 41 percent of the residential transactions.
Average selling prices for the month were generally in line with those of the first five months. At mid-year, the average selling price of a single family home was $770,123, up 8 percent from this time a year ago but only up a more modest 1 percent for all of last year. Multi –family average selling prices have actually declined, 8 percent from June 2012 and 4 percent from the end of last year. Sales of raw land have picked up some from a year ago with 51 transactions in the first six months versus 45 last year. Average prices are up from mid year last year but down slightly from year end at $306,257.

Posted in Summit County Market Statistics | Tagged , , , , | Comments Off on First six months sees 23% increase in Summit County real estate activity

Summit County Real Estate Post Double Digit Gains in May

Real estate transactions posted another strong gain in May despite relatively tough comparisons. For the month, sales were up 18 percent in both number of transactions and dollar volume. That is on top of a May 2012 which itself had seen 22 percent and 25 percent gains in volume and dollars respectively. Transactions have now shown year over year gains in 13 of the last 14 months and dollars have increased in 10 of the last 11. Year to date, volume is up 21 percent and dollars up 18%. There is little doubt at this point that demand is clearly on the rise.
Despite the higher demand and relatively low inventories—down about 11% – price gains have been more selective. Year to date single family average selling prices are up 10% from this time last year but are still flat versus all of 2012 at $773,861. Multi-family housing has seen its year to date average sales price actually decline 6 percent to $337,944 versus a year ago
Once again we caution the “average selling prices” can be deceiving when measuring the performance of the market. This number is influenced as much by mix as by actual changes in property values. The hot spot in terms of volumes continues to sit in the sub $500,000 range where 64 percent of this year’s transactions have occurred. To test whether the lower average selling prices for multi-family housing was mix or actual value related we ran a time series of sales for several larger condo developments where like properties were sold over time. In all cases the trend of rising prices from 2004 to 2007 and falling prices from 2008 to 2011 was clear. However, beginning in 2011 prices in each case appeared to have stabilized. If you would like to see a trending chart for the condo complex where you own or are contemplating buying, email or call and I will gladly provide you a complimentary copy .

Posted in Summit County Market Statistics | Tagged , , , , , , | Comments Off on Summit County Real Estate Post Double Digit Gains in May

April Summit County real estate shows another strong gain.

April Summit County real estate sales showed another strong month with double digit increases in both volume and dollars. Total transactions rose to 134 or a 19% gain over the year ago period and showed the seventh consecutive month with year over year gains. Dollar sales increased 22% to $64.3million making it the ninth month out of the last ten with a positive showing.
Year-to-date average selling prices for single family homes, ticked up from $758,714 in March to $767,545 and were 4% ahead of this time last year. Our sale of a $3.4 million home in The Highlands was a major contributor to that move.
Multi-family ASPs did move up modestly on a consecutive month basis but at $319,227 were still 12% below the year to date figure in April of 2012. While it is tempting to conclude that pricing is still under pressure in the multi-family market, we sense this is more a mix issue than one of falling prices. To test that hypothesis, we sampled the pricing trends in five popular condominium complexes. Looking only at 2 bedroom, 2 bath units we generated charts of the pricing per square foot over the last ten years for each of those complexes individually. Increases during the market run up from 2002 to 2006 were quite apparent as were decreases in the 2007 to 2010 time frame. Pricing since 2010, however, appeared to be relatively stable in all five cases. While this wasn’t a scientific nor exhaustive study, it is consistent with our currently low inventory (down about 12%) and our rising sales volumes. If you would like to see the trend for the complex where you own or have interest, drop me an email and I will send you a custom

Posted in Summit County Market Statistics | Tagged , , , , , | Comments Off on April Summit County real estate shows another strong gain.

Falling inventories generating higher prices.

Fannie Mae is predicting that falling housing inventories nation wide are likely to contribute to a 5.1% increase in selling prices in 2013. Summit County is certainly participating in that inventory decline with listings down 12.5% from the same time a year ago. High-end prices have already started to rise and if current trends continue the rest of the market is sure to follow.

Posted in Random Thoughts | Comments Off on Falling inventories generating higher prices.

First quarter off to bang-up start

The real estate market in Summit County is getting off to a far stronger start than in 2012. Last years first quarter saw an 8% decline in transactions and 5% decline in dollar volumes. In contrast, this year’s first quarter has seen a 24% increase in transactions to 318 and a 17% increase in dollar sales to $140.8 million. March was a very strong contributor to those gains with transaction volume increasing 46% to 118 sales, the highest March number since 2008. As can be seen in the chart below, this was the sixth month in a row of rising sales volumes and the 11th month out of the last twelve that showed a gain. Interestingly, those gains were made without a single sale over the $1 million mark in March. The prior two months had seen 16 sales over the million dollar mark. Nevertheless, dollar volume was still able to post a 25% increase over the prior year and showed the highest dollar volume for a March month since 2008. With the dearth of million dollar sales, year to date average selling prices for single family homes dropped sharply from the $878,488 of the prior two months to $758,718 or just below the average for all of last year. Average selling prices for multi-family units fell slightly to $306,006 but are running about 13% below all of last year. Average lot prices did again show some improvement and year to date the average price now stands at $322,956 versus an average of $309,512 for all of 2012. Lot volumes were up from March 2012 at 13 versus 8 but volumes are still running at less than a third of those seen at the peak of the market. Foreclosure activity showed an improving picture. While actual foreclosure volume rose from 7 to 12. Notices of Elections & Demand (the start of the foreclosure process) dropped dramatically from 59 to 10.

Posted in Summit County Market Statistics | Tagged , , , , , , , , | Comments Off on First quarter off to bang-up start

Sales volume continues to rise in Summit County

Summit County real estate transaction volume showed another double digit increase in February rising 16% to 92 transactions.  That follows a 13% gain in January and a 12% increase for all of 2012.

Dollar volume did not fare as well as sales shifted to lower priced properties.  Dollar sales totaled $40.7 million down 6% from $43.1 million in February of 2012.  As has typically been the case over the last 10 years, both volume and dollars took a seasonal dip versus January falling 15% and 24% respectively.

Average selling prices for single family homes at $878,488 is still running well ahead of the $764,455 for all of last year.  In contrast, multi-family pricing is well down at $309,637 vs $353,339 in 2012.  It is a little early in the year to decipher a definitive in trend and the variations so far seem to reflect more a change in mix than actually a substantial change in pricing for like properties.  Our sense is that per square foot pricing is rising at the high end of the market ($1 million and up) while the lower end (under $600,000) is flat at best.

Overall, volume does remain concentrated in the lower end of the market.  In the month, 76.6% of sales, both single and multifamily, were less than $600,000.  That number was 77.1% for the year to date versus 72% for the year to date number a year ago.

Notably, inventory continues to show substantial year over year declines.  As of March 1, inventory was down a little over 10% from the prior year, which itself had seen 12% from 2011.  If volumes continue to rise and inventories fall, stronger prices are sure to follow.  Lower distressed property activity should also contribute to a firmer market.


Posted in Summit County Market Statistics | Tagged , , , , , , , , , | Comments Off on Sales volume continues to rise in Summit County

January sales off to a strong start

Although showing its typical seasonal dip, Summit County real estate sales continued to show strong year over year gains.  Transaction volume dropped from 185 sales in December to 108 in January but that still reflected a 13% improvement over a year ago.  Dollar volume fell to $53.4 million from $87.2 million in December but that still reflected an impressive 33% increase from January of 2012.

Sales in the low end of the market were quite robust with 35 transactions or 39% of the total volume made at less than $300,000.  For all of 2012, sales of properties under $300,000 were only 32% of total volume.

Interestingly, the high end of the market was also strong.  There were ten sales over $1 million including one in excess of $4 million.  That is only one less sale than in December even though overall sales were down 42%.

Aided by a $4.2 million sale, the average selling price of a single family home rose to $974,971.  Even without that sale, single family ASPs rose to $867,470 versus $764,455 for all of last year.

Land prices also were able to post an increase in average selling prices rising to $342,825 versus $309,512 for the prior 12 months.

Multi-family ASPs continued to decline, hitting $311,640 versus $358,339 for 2012.  That drop is likely more reflective of a higher volume of  purchases at the lower end of the market than it is of actual price declines in the market.

Distressed property activity was flat with eight NEDs (vs six a year ago) and five foreclosures versus six in January of 2012.


Posted in Summit County Market Statistics | Tagged , , , , , , , , , , | Comments Off on January sales off to a strong start

Check out our newest tutorial – Home Inspections

Are you a new home buyer and have questions about a home inspection.  Are you a seller wondering if you should have an inspection before you list?  These questions and many more can be answered in this video where Eric Buck, associate broker RE/MAX Properties of the Summit interviews Joni Ellis and Pat Wathen of Independent Property Inspections about the home inspection process.  See the video here: http://www.ownthesummit.com/real-estate-tutorials/ by clicking on the “Home Inspections” thumbnail.

Posted in Random Thoughts | Tagged , , , , , , , | Comments Off on Check out our newest tutorial – Home Inspections

Summit County Sales Close Year on High Note

Summit County saw a bang up December allowing the  full year to end with solid gains.  For the month, dollar sales rose 42 percent to $87.2 million while sales volume increased to 185 transactions.  Those numbers represent the third highest dollar volume and second highest transaction volume for the year.  The strong results allowed the full year to record a 13 percent increase in dollar volume to $772.9 million, while the 1,624 transactions represented a 12% increase over the prior year.  That full year performance is particularly impressive given that at mid year, transactions were up only 3 percent and dollar volume was actually down 7 percent.


News was a little more mixed on the pricing front.  While the average selling price of a single family home rose 4% in the year, the average price of a multi-family unit fell a similar amount.  However, in 2011 multi-family pricing dropped 14% so it would appear we are nearing bottom in multi-family as well.  The more volatile vacant land market showed a 25% increase.


Looking at sale price points, the increase in unit volume slightly favored the mid tier of the market.  Sales under $600,000 represented 73.6 percent of the volume versus 74 percent last year.  Sales between $600,000 and $1 million were 18.3 percent versus 17.2 percent and sales over $1,000,000 were 8.1 percent  of the total versus  8.6.  There also was good news for the distressed market.  Newly initiated foreclosure proceedings dropped by 23 percent and properties actually lost at a foreclosure auction were down 27% to 165.


Rising volumes, falling inventories and declining volume of foreclosed properties certainly bodes well for property values looking forward.

Picture1

Posted in Summit County Market Statistics | Tagged , , , , , , | Comments Off on Summit County Sales Close Year on High Note